02:00
Debugging
Reset - details
Have you tried turning it OFF and ON again?
Session -> Restart R or
Ctrl + Shift + F10 (Windows),
Cmd + Shift + 0 / Cmd + Shift + F10 (Mac)
usethis::use_blank_slate()
or Tools -> Global Options -> Workspace
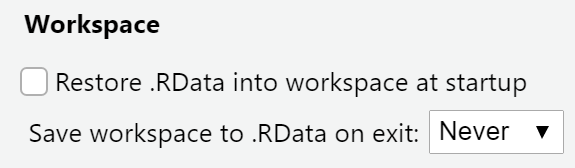
Your turn, exercise 00
Either on your Posit cloud workspace or your personal computer…
Set your Workspace options as shown.
usethis::use_blank_slate() or
Tools -> Global Options -> Workspace
02:00
But what if

Debugging tools

Debugging your code

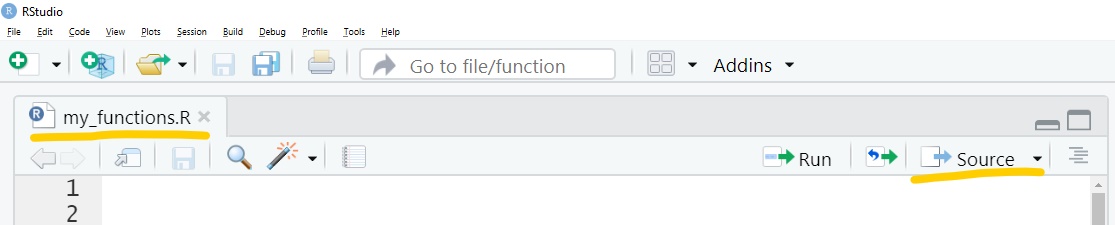
Sourcing
⚠️ name your script with functions
⚠️ source your script with functions
for the best debugging experience 😎
traceback()

shows the sequence of calls that lead to the error.
Richer traceback
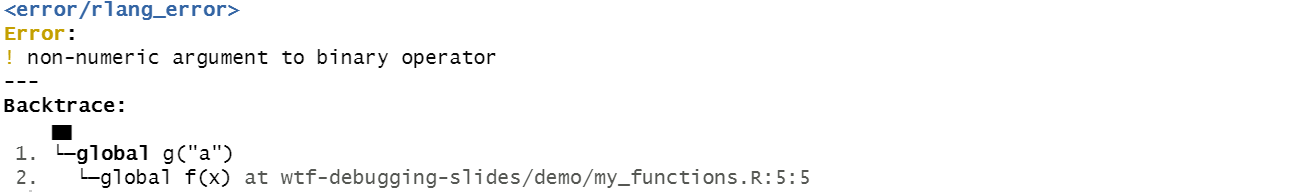
options(error = rlang::entrace)
could go in your .Rprofile
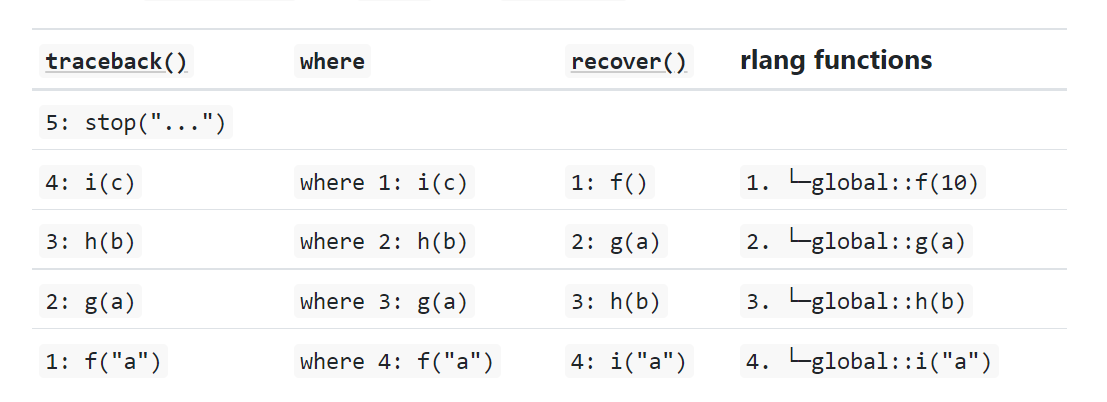
traceback vs rlang functions
Numbering and ordering differs between traceback() and rlang functions.
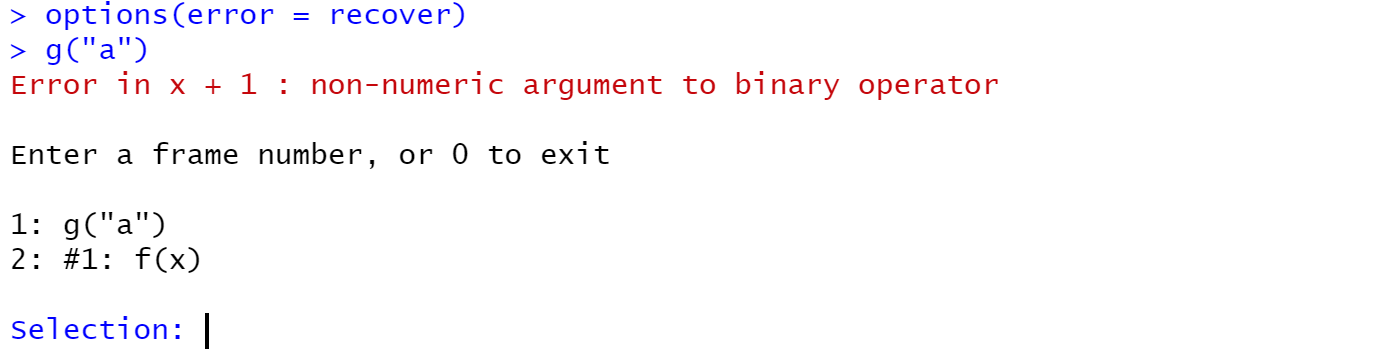
Interactive debugger
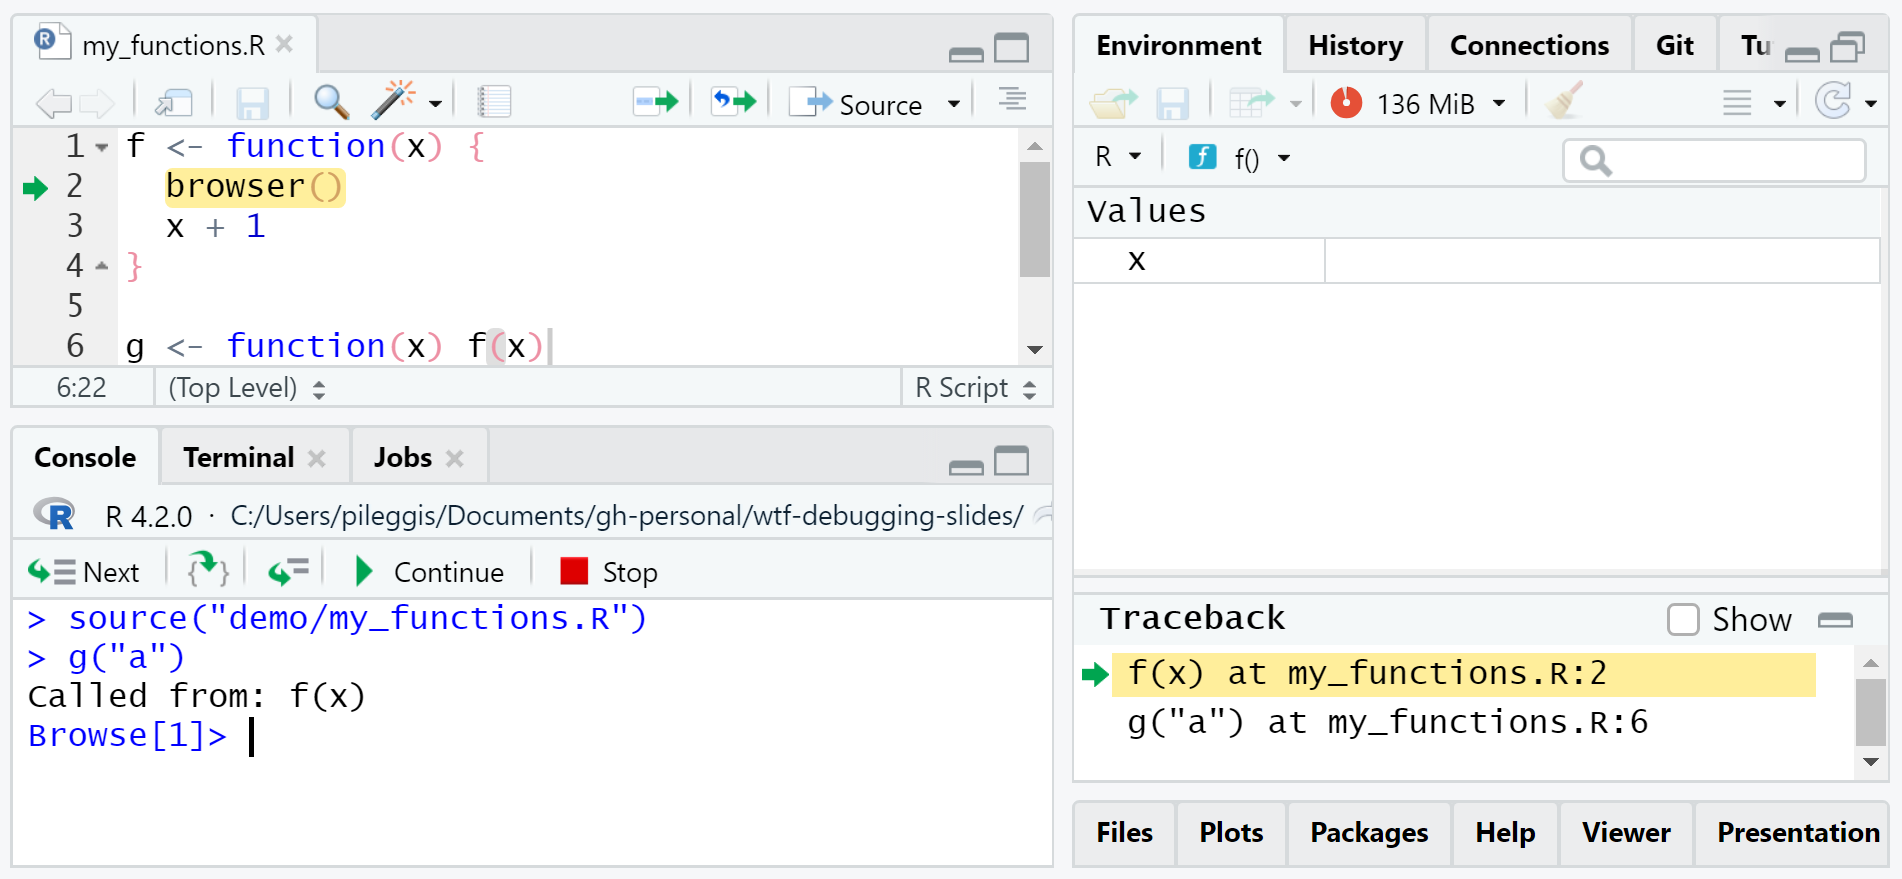
Debugging your code
Debugging in the RStudio IDE

Editor breakpoints
red circle = breakpoint = browser()
(but you don’t have to change your code)
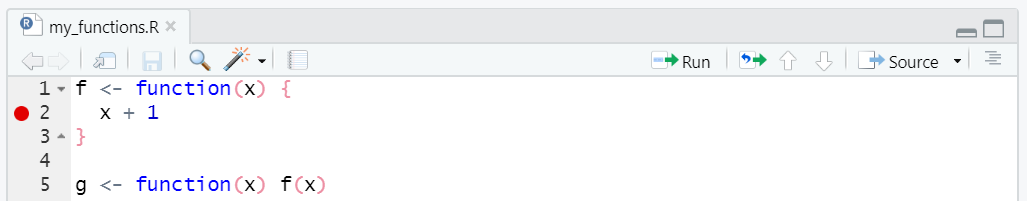
Set / re-set an editor breakpoint:
click to the left of the line number in the source file
press Shift+F9 with your cursor on the line
Editor breakpoints
red circle = breakpoint = browser()
(but you don’t have to change your code)
To activate, either
click IDE Source button, or
debugSource(“demo/my_functions.R”)
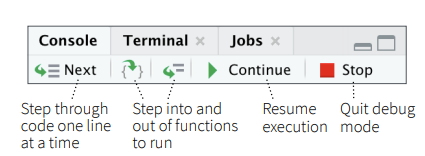
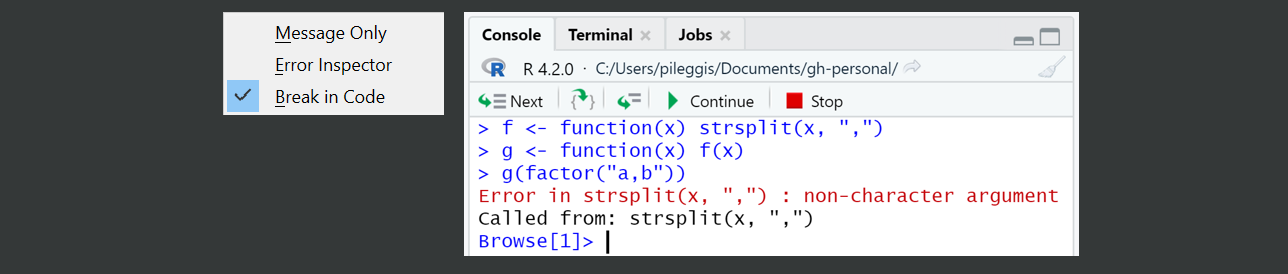
Debugging console
IDE on error
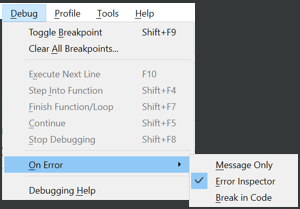
IDE message only

IDE error inspector
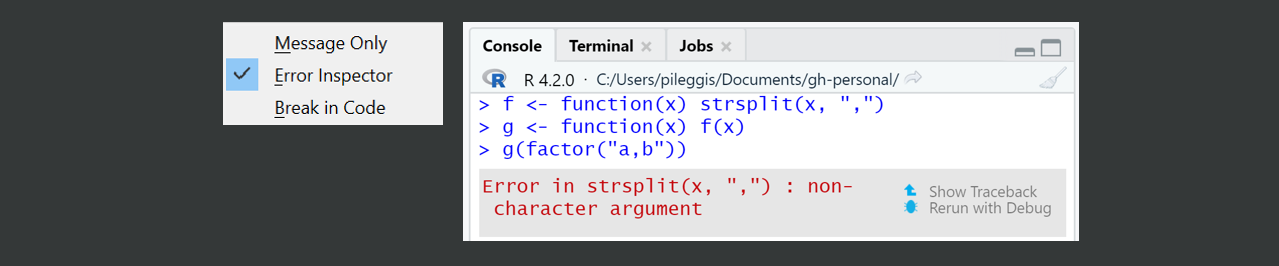
IDE break in code
Debugging in the RStudio IDE
Debugging their code

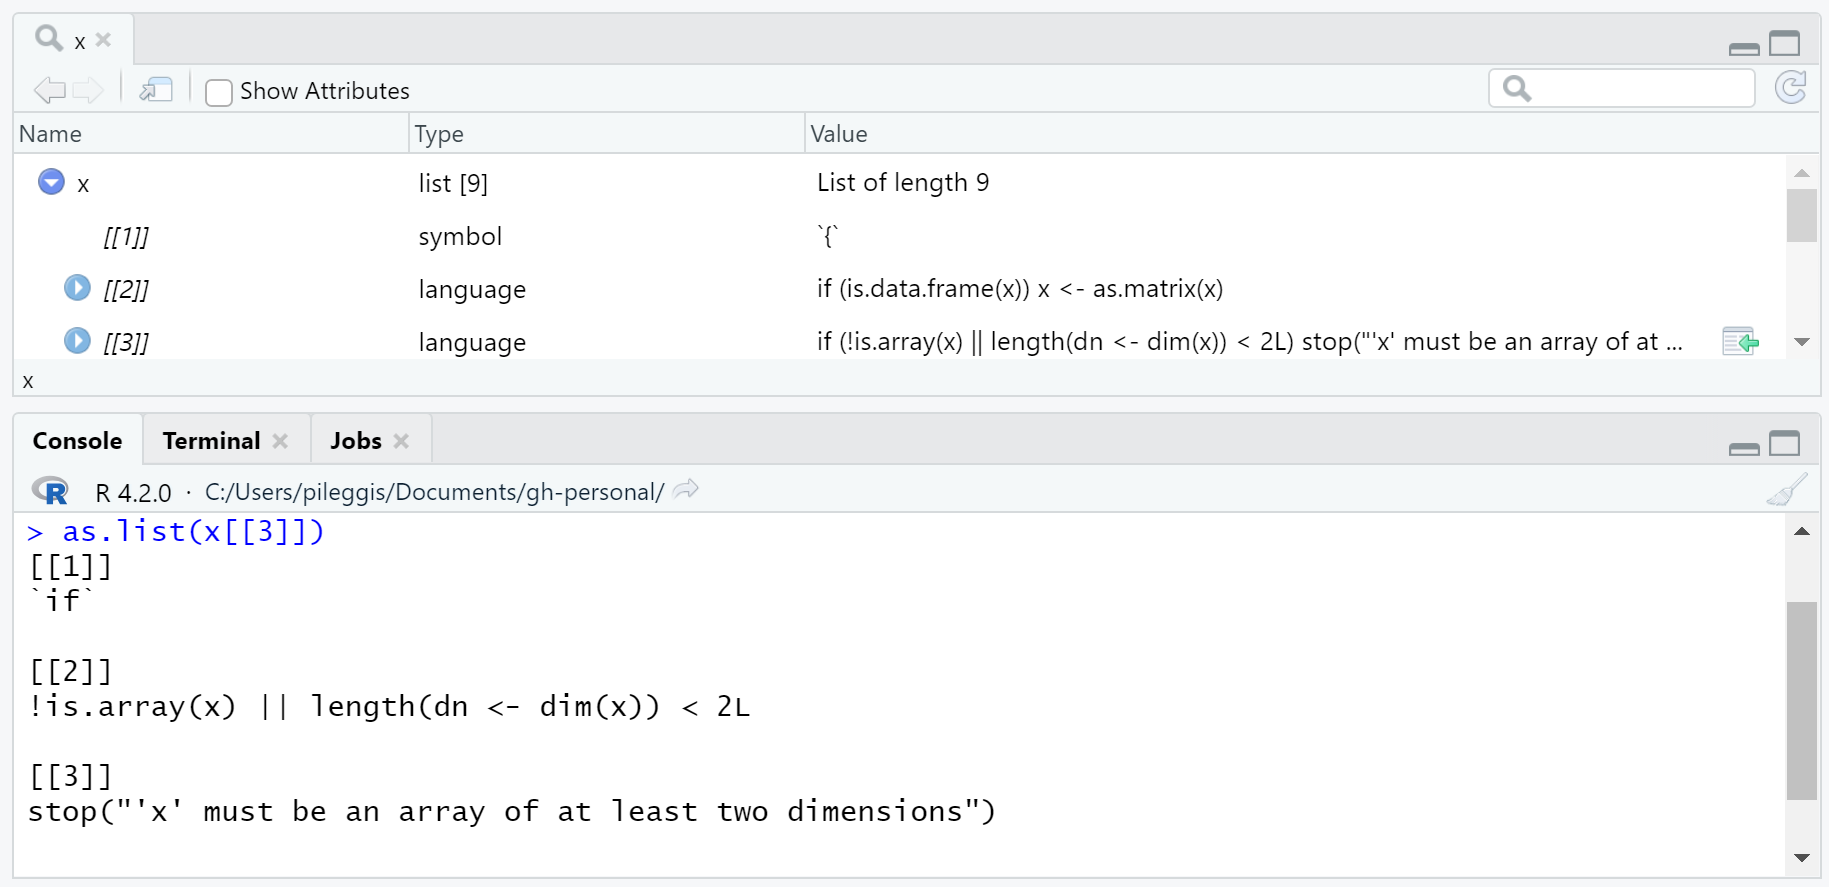
recover example
navigating function steps
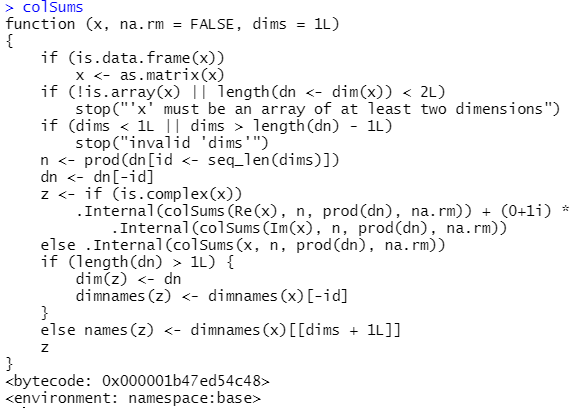
investigate 🧐 the function with as.list() + body()
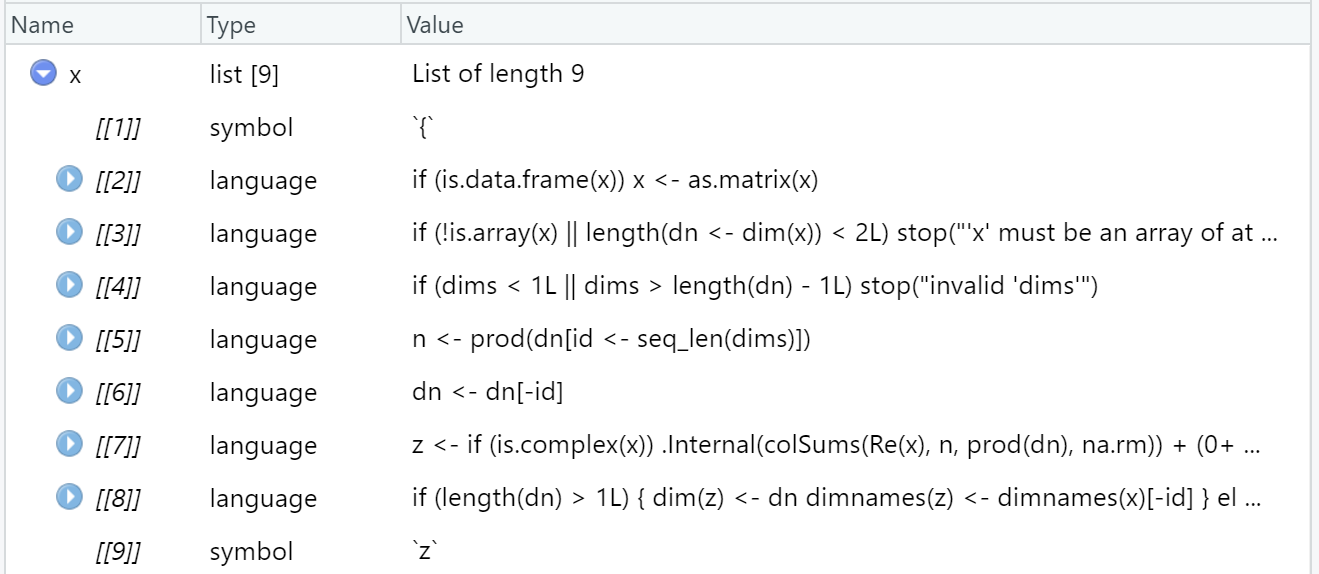
identify function step
Debugging their code
Debugging special cases

Pick your favorite

Go forth,
and learn from your bugs!

traceback
interactive debugger
your code vs
their code